This year, HubSpot added a new dashboard to all HubSpot portals called the Web Analytics Dashboard. In this blog, we'll cover all the metrics that are tracked on this new dashboard, where to find it in your portal, how to share the data with your team, and times when you can share this informationwith your marketing team.
Where to Find Your HubSpot Web Analytics Dashboard
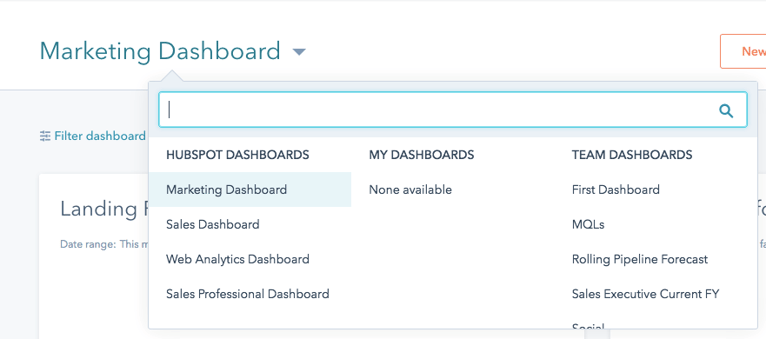
When you log into your HubSpot account, you will see your default HubSpot Marketing Dashboard. If you click on the arrow next to word "Marketing Dashboard" you will be able to choose from any of your HubSpot Dashboards, one of them being your Web Analytics Dashboard. Having a dedicated place for website analytics has been a long time coming for the HubSpot software and we are very glad to see this improvement this year!
HubSpot Web Analytics Dashboard Metrics
Now, let’s cover what all this dashboard includes. There are many foundational website analytics aspects that this dashboard will track for you out of the box. Some of those analytics include the following:
- Sessions: The number of sessions over time, split out by new vs. returning sessions. Note that this report is tracking new sessions, not new visitors. This can be helpful to see your website traffic trends over time.
- Traffic Metrics: Total sessions, % new sessions, and % mobile sessions during your selected time frame. This will give you a high-level understanding of what percentages of your traffic over time are new sessions, mobile sessions, and if your number of user sessions is increasing or decreasing.
- Engagement Metrics: This is your website’s bounce rate, average time on site, and pages per session. This will give you a high-level understanding of the engagement level your website visitors have with your site when they visit.
- Session Sources: Sessions over time, split out by original source (organic, paid, etc.). This will give you a better understanding of the original sources that your website visitors are coming from and which channels are directing more of your audience to your site over time.
- New Visitors by Source: Traffic from new visitors, broken down by original source. This will show how new visitors are finding your website.
- Session Engagement Rates by Source: Bounce rate, average time on site, and pages per session, broken down by original source. This will take your sources of traffic and split them down by engagement. This gives you a better understanding of how engaged audiences are with your website based on how they found your website.
- Average Pages per Session by Source: How many pages visitors viewed in an average session, split out by original source.
- Average Session Length by Source: Number of minutes and seconds spent on your website per session, broken down by original source.
- Bounce Rate by Source: Bounce rate --number of sessions with only one page view divided by total number of sessions --by original source.
- Device Type Breakdown: Mobile vs. desktop, in pie chart form. This will show you what percentage of your traffic is coming from which devices. This is a great indicator of how much of your audience is visiting your site from on-the-go devices or desktop computers.
- Session Country: The countries where your sessions originated, identified by IP address. This will give you insight into any other countries that are currently finding your website.
Sharing your Web Analytics Dashboard
Don’t forget that when using this dashboard to track your website analytics you have many options for sharing in the top right of the dashboard page. You can “share” this report in a one time or recurring email, export the dashboard in a PDF and share that, or customize your dashboard with these features in the top right of your dashboard page.
Using your Web Analytics Dashboard
There any many ways to use these insightful website analytics to make marketing decisions going forward. In order to be sure you’re not constantly checking in on your Web Analytics Dashboard, (because honestly who has time to check one more thing every day) and also to ensure you are using this data in an informative way to make better decisions going forward, here are a few of my recommendations for putting all this data to good use.
Monthly Review
Checking in on your website analytics in terms of overall traffic, user engagement, and sources that are driving traffic to your website can be very powerful on a monthly basis to see what trends are forming as a result of your marketing efforts and your users’ actions with your website. Comparing your website metrics month over month can give you a solid pulse on if users are engaged with your current site and what marketing efforts are driving users to your website.
HubSpot Pro Tip: Don’t forget to setup a monthly recurring email of your Web Analytics Dashboard to you and your team. This way the web analytics report will come straight to your inbox each month!
Campaign Launch Review
When launching a new marketing campaign that promotes your website pages it is vital to check in on how that is affecting your user engagement on your site. Depending on what the campaign entails the time frame of when to do this can vary, but when you’re setting up a new campaign I recommend creating a custom task in HubSpot’s Calendar tool to remind you or your team to pull a website analytics report after your new campaign has been running. This will show you if there are peaks in engagement or some abnormal drop off when the campaign was launched and ensure you are tracking the success and changes based on your new marketing efforts.
User Trend Tracking
Over time, as you continue to use these metrics when making decisions on your website and in your marketing campaign planning, keep any eye out for developing user trends, sources that are driving the most traffic to your site and leveraging those channels that are resonating with your industry. Be sure to flip your dashboards to year over year metrics where you can to see if your user engagement "peaks" or "valleys" are due to seasonality changes in your industry. These areas will help you to see how your users are engaging with your marketing efforts, your site overall, and any unusual changes in your metrics due to pain points or website issues.
There are so many metrics that we are tracking now as marketers and quite frankly it’s very easy to let those analytics overwhelm your team’s decision making. Overall, be sure to look for trends in your traffic for your site and campaigns specifically and avoid getting pressured by small changes in your analytics. As the digital industry changes so quickly, some analytic changes can be due to many of the moving pieces in the digital space.
Lastly, if you’re not sure why something is dropping or growing significantly, be sure to investigate this area further or reach out to a partner for assistance in diagnosing your analytics and what those metrics mean for your future project planning. Feel free to let us know in the comments or message me directly with any analytics questions you have about your website or marketing campaigns.
