Using HubSpot Social Reports to Drive Social Strategy
Sarah Corley#Digital Marketing, #Inbound Marketing, #Social Media, #HubSpot

We look at how to use HubSpot's Social Reports to learn valuable information about how people are interacting with you on social media.
The HubSpot Social Reports Tool is a fantastic resource that allows you to see which elements of your social media content strategy are performing better than others, in real time. With the ability to compare time frames, channels, and platforms instantly, you can analyze your social media analytics throughout the month, instead of just at the end of the month. This proactive approach will strengthen your inbound marketing strategy and hopefully bring you better success rates on your social media channels.
With that in mind, I’ve crafted 3 example scenarios that will help you navigate the HubSpot Social Reports Tool:
Scenario #1: My Twitter traffic seems to be increasing, and I don’t know why.
Let’s consider a case in which you want to determine where the increase in your Twitter traffic is coming from. To do so, navigate to Social/Reporting and select the “Compare Time Frames” section. This report allows you to select the time frame that you want to look at (this week, month to date, last 30 days, etc.) and compare it to the previous time period. When you’re looking at recent changes in traffic, this is often the first and best place to start your search.
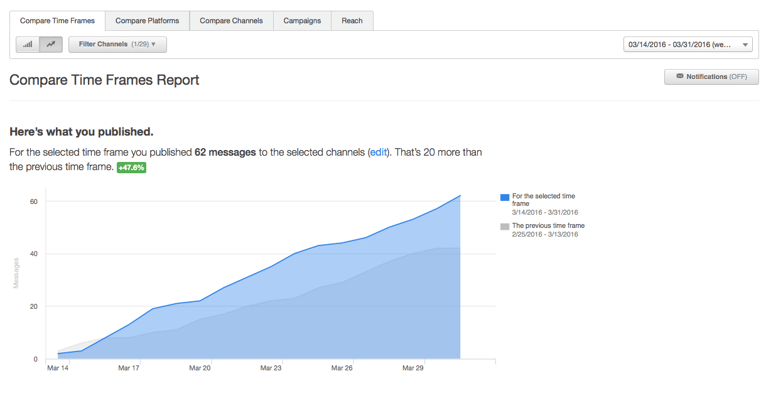
The screenshot below shows that you’ve published 20 more messages than the previous week, an increase of almost 48%. This could definitely be a factor in the increased Twitter traffic.
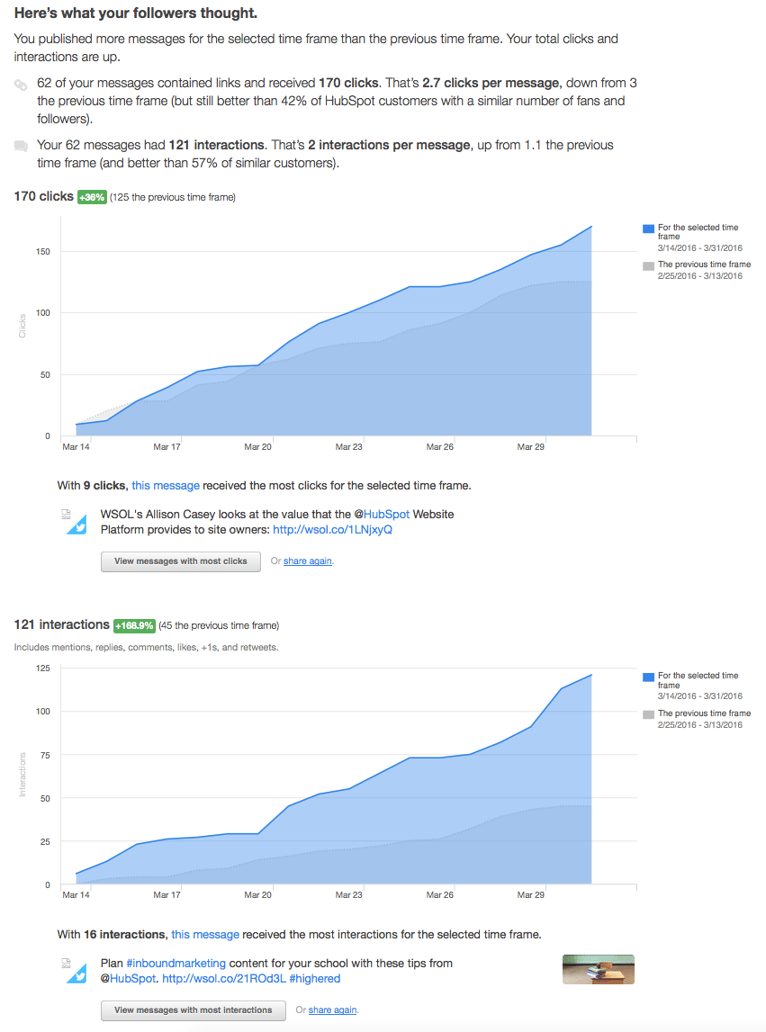
As you continue to scroll down the page, you’ll see that your total clicks and interactions are up:
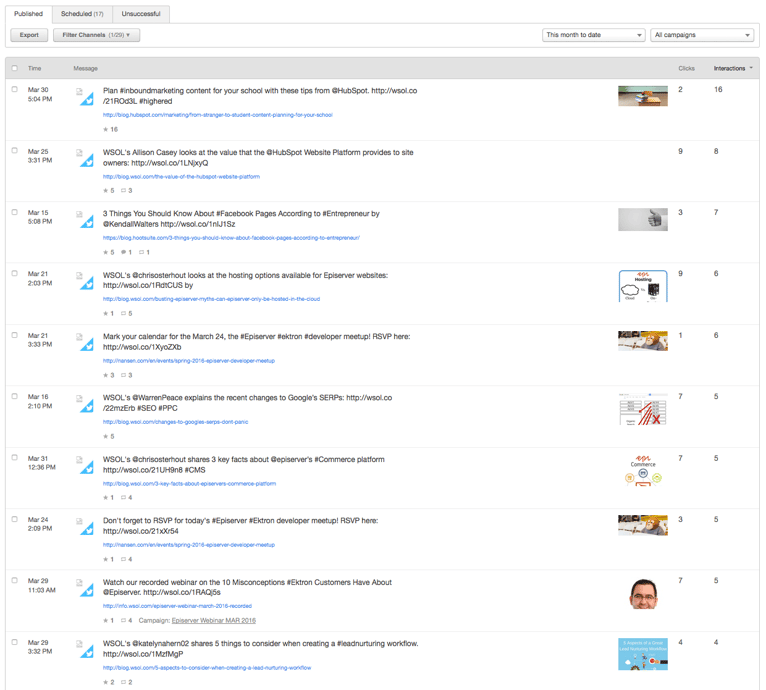
The magic comes with the click of the “View messages with most clicks or views messages with most interactions” button. Doing this will show you exactly which messages you published that had the most clicks and interactions—valuable information for social media marketers!
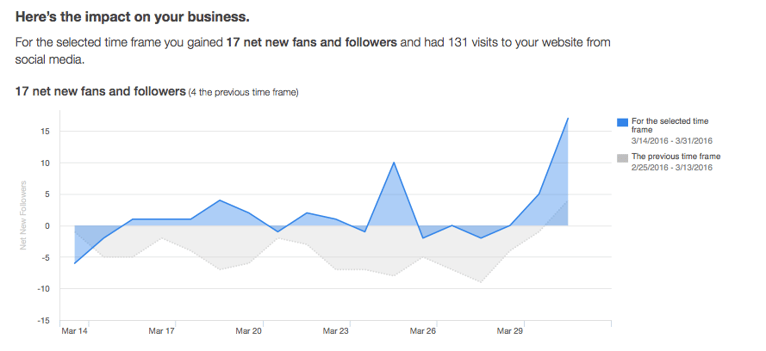
You can also see the direct impact to your business. In this case, HubSpot shows that you gained 17 new followers during the selected time period.
Since we’ve checked the messages that you’ve posted, the new follower count, and the messages with the most clicks, it looks like the answer to this scenario is that you were creating great content at the right time for the right audience. Great work!
Scenario #2: We’re halfway through a company campaign, and I want to see how it’s performing as a whole.
Navigate to Social/Reports and select “Campaign Tool.” Choose the specific campaign and the time frame (most likely it’ll be month-to-date). Don’t forget to filter your channels if you want to include or exclude specific platforms
Your metrics for the campaign will be instantly available. You can see how many messages were sent out in the time frame for that campaign, how many messages per day/week/month, and what platform was used. If you scroll down, you’ll be able to see a graph of how many interactions you had as well.
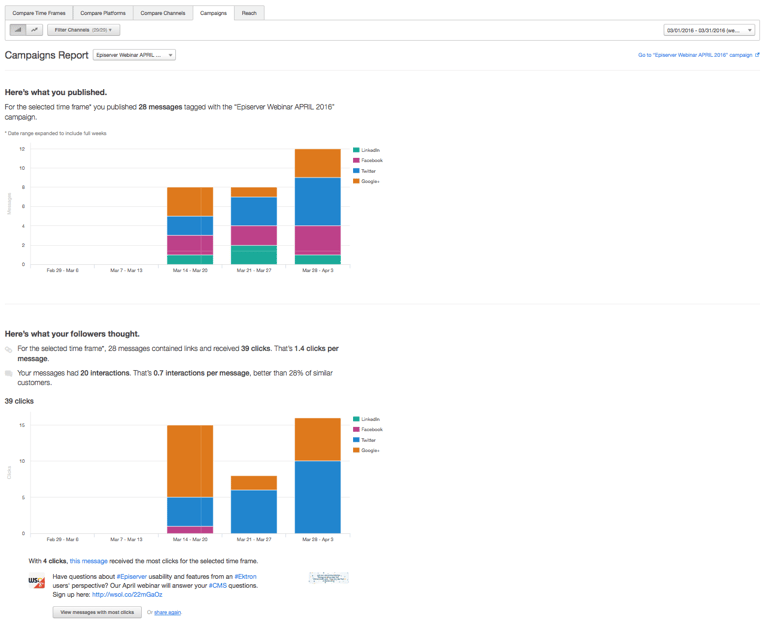
Seeing how your campaigns are performing in real time is invaluable information that can help you tweak or change your messaging if you aren’t seeing the results that you want. You can even use the Social Publishing Tool to clone your highest performing campaign messages.

Scenario 3: I want to see my total reach on a specific platform.
Navigate to Social/Reports and select “Reach.”
In the Reach report, HubSpot shows you the following metrics for your selected platform(s): the total reach, growth for the selected time frame, growth from the previous month time frame, and the change between those two periods. The reach report tab is important because you can (finally) compare and contrast the reach between your social channels in the same tool. No more guessing if your Twitter account is outperforming Facebook; the data is right there in one place.
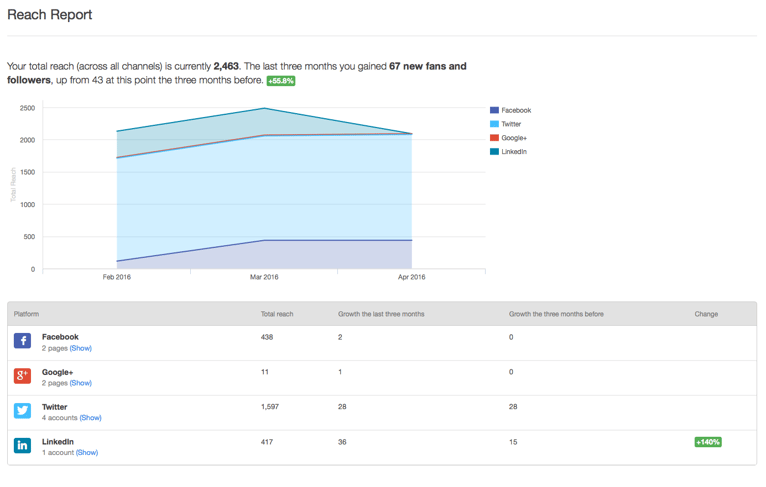
The HubSpot Social Reports Tool is a great time saver, since it has all your reports already built out for you. All you need to do is filter the data according to your KPIs and start analyzing. There are many more cool features to the HubSpot Social Reports Tool, and you can learn about them here. In the meantime, please feel free to contact us if you want to know more about using HubSpot’s Marketing Automation Platform to build a successful Inbound Marketing Strategy. We look forward to helping you find success online!
Related Posts
7-Step Guide to Effective Social Media Ads
We share how to plan a successful paid social media campaign in 7 easy steps.

How Brands can Navigate Elon Musk's Twitter
Should the changes at Twitter impact your social strategy? Is it still an effective way to connect with your customers? Read more to learn why or why not.
Results Matter.
We design creative digital solutions that grow your business, strengthen your brand and engage your audience. Our team blends creativity with insights, analytics and technology to deliver beauty, function, accessibility and most of all, ROI. Do you have a project you want to discuss?
Like what you read?
Subscribe to our blog "Diagram Views" for the latest trends in web design, inbound marketing and mobile strategy.
