For administrators who are used to working with physical servers, this shift to the cloud can be somewhat jarring. However, the versatile tools that AWS provides more than make up for the perceived loss of control that comes with using virtual machines. Today, we’re looking at one of those tools: Amazon CloudWatch, which provides powerful monitoring of AWS resources and applications.
Intro to CloudWatch
Amazon CloudWatch provides robust monitoring of your entire AWS infrastructure, including:
- Virtual instances hosted in Amazon EC2 (Elastic Compute Cloud)
- Databases hosted in Amazon RDS (Relational Database Services)
- Data stored in Amazon S3 (Simple Storage Service)
- Elastic Load Balancers
- Any other AWS resources
Administrators will be able to track a wide variety of helpful metrics, including:
- CPU usage
- CPU latency
- Network traffic
- Available storage space
- Memory
- Custom performance counters
AWS also provides access to system and application logs, and custom alarms can be created to provide near real time notification when specific phrases or metrics appear in the logs, or when certain events take place, such as low disk space. Dashboards can also be created to display graphs and statistics for both up to the minute and historical data.
With all of these capabilities, CloudWatch allows administrators to easily monitor multiple instances and resources from one console.
CloudWatch in Action
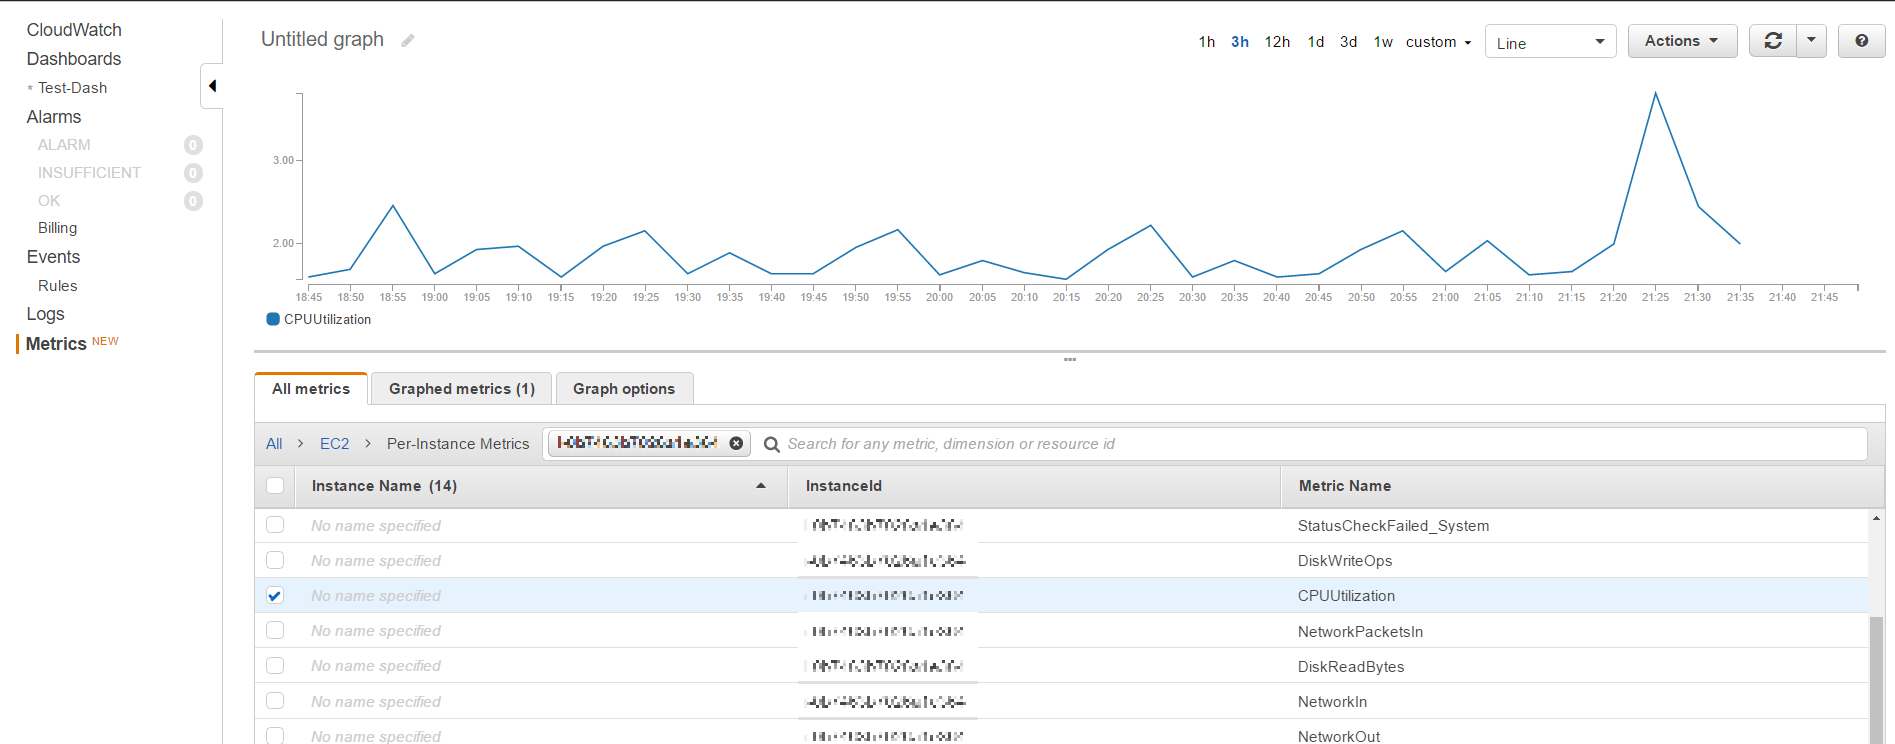
Let’s take a look at how administrators can use CloudWatch to monitor their AWS instance. Here's an example of a graph displaying the CPUUtilization metric for an EC2 instance, showing what percentage of the CPU has been used over time:
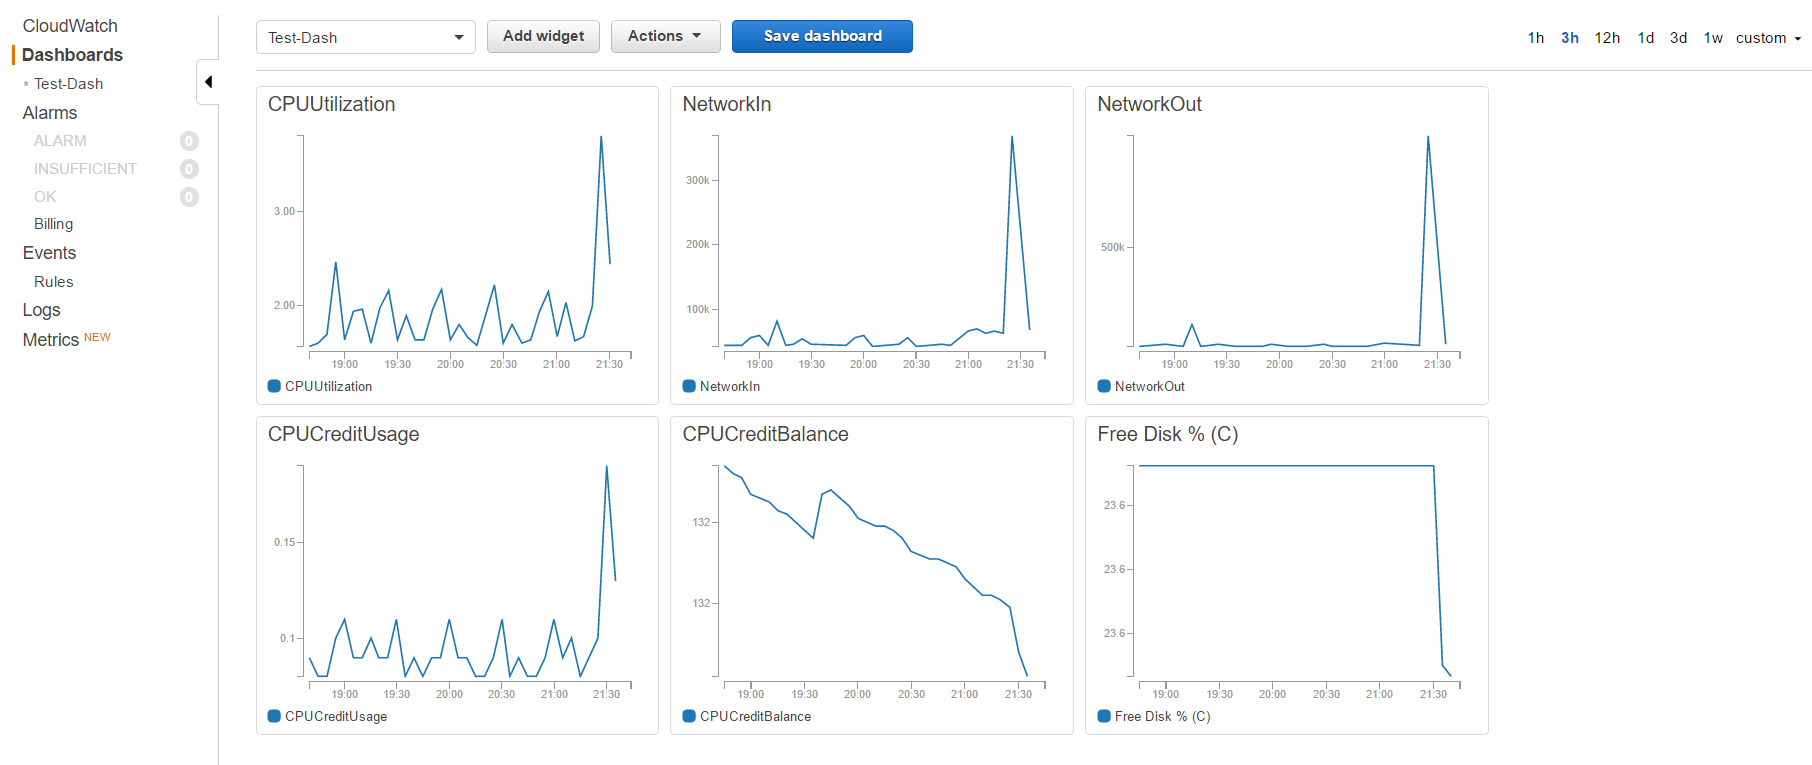
Graphs can be compiled into a dashboard, allowing administrators to view their AWS systems' performance at a glance:
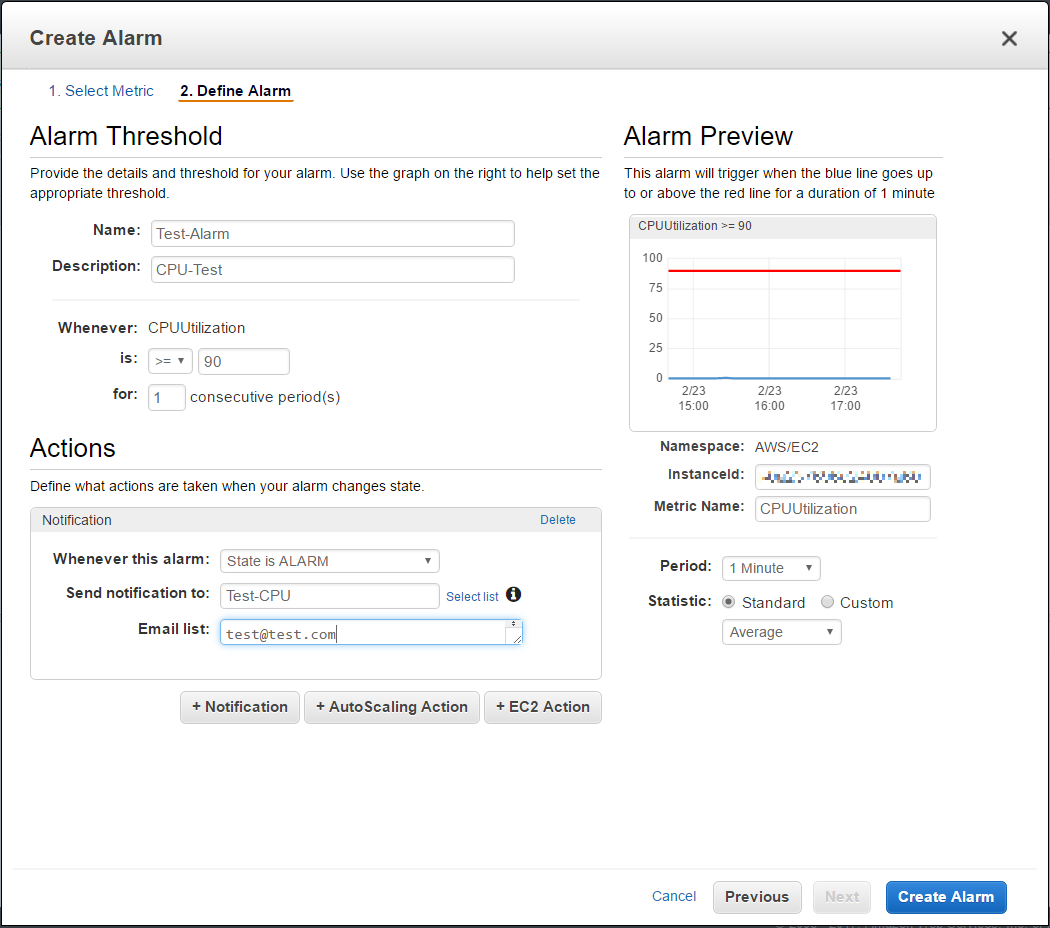
Alarms can also be created to notify administrators when metrics reach a certain point. For instance, here is an example of an alarm that will send a notification email when the CPUUtilization metric is greater than or equal to 90%:
As you can see, the options that CloudWatch provides for administrators are powerful and customizable, allowing administrators to monitor their AWS services and ensure their systems are running properly. Please stay tuned to the Diagram blog, where we'll continue to take a closer look at AWS and CloudWatch, including how to set up custom metrics. If you have any questions, please feel free to contact us or leave a comment below.
