Digital Marketing Case Study
Partnering to create and implement a two-year digital roadmap for organic search, paid search, and social marketing.
Background
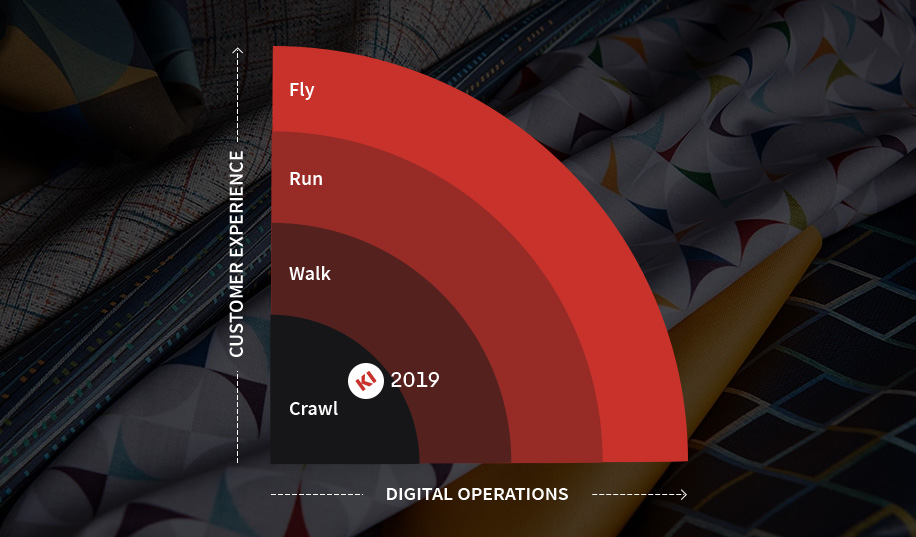
Following the launch of their new website in 2019, KI wanted to supercharge their digital marketing efforts.
At that time, they were in the “walk” stage of the digital agility model. KI needed a strategy to help move them to the next level of maturity, so they partnered with Diagram to create and implement a two-year digital roadmap with specific strategies for organic search, paid search, and social marketing.
Our Approach
Diagram takes a holistic approach to SEM strategy for our clients, which includes organic search traffic (SEO), paid advertising traffic (PPC), and optimization (CRO). The goal is to measure ROI and reduce the cost of traffic and conversions over time.
SEO/SEM
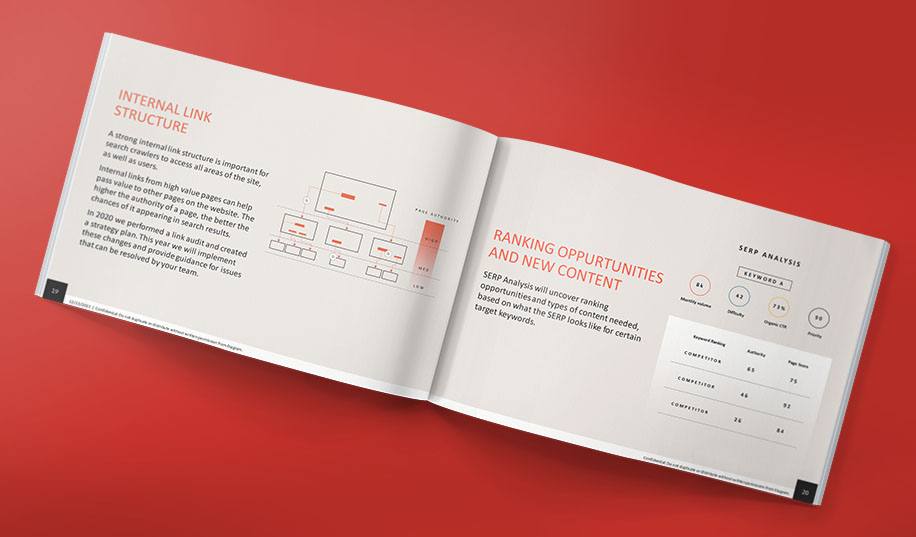
Diagram provides monthly SEO technical audits and error resolution and prioritizes technical projects in order of impact, such as site map optimization, schema markup, and more.
The KI and Diagram teams collaborate in SEMrush, Google Analytics, and Google Data Studio, providing full transparency on all SEO activity initiatives. Ongoing keyword research and SEO optimization briefs ensure that new and existing content is optimized for search. Briefs include recommendations for H1s, meta description, headline, length, recommended keywords, and more.
- Monthly Technical Audits and Issue Resolution
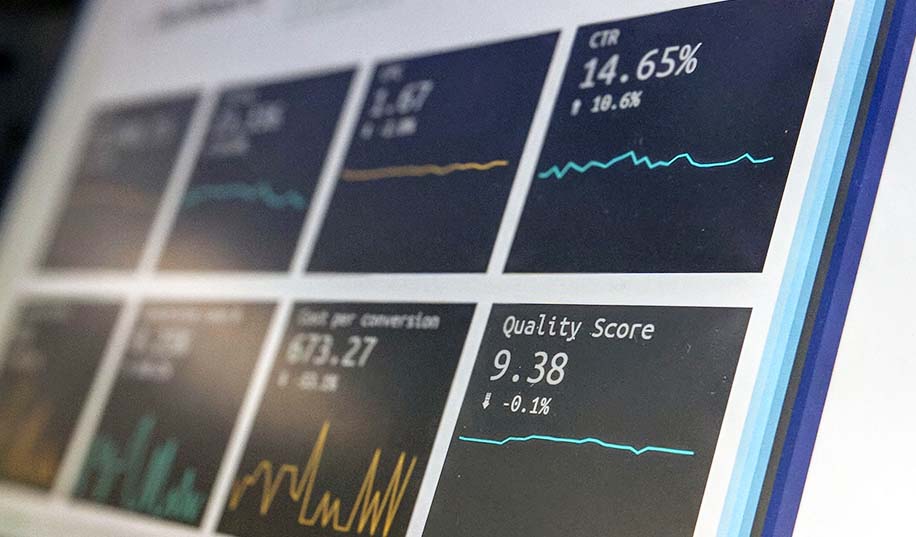
- Monthly Analytics and Reporting
- Keyword Research
- Sitemap Optimization
- Content Audit(s) and Recommendations
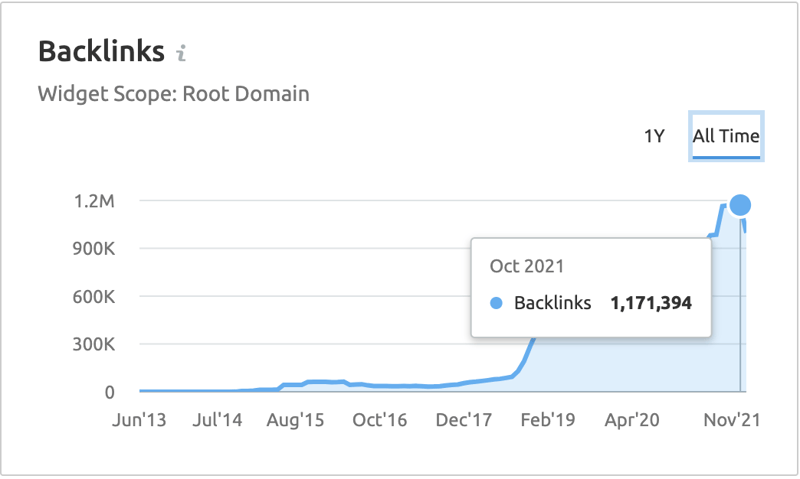
- Backlink Audit and Competitive Research
- Crawl Budget Analysis
- Click-Depth Analysis
- Ongoing Training and Strategic Guidance
- Ongoing Content Optimization and Conversion Strategies
Pay-Per-Click Advertising (PPC)
Google Ads accounts need consistent monitoring and monthly optimization of costs, impressions, and conversions. Diagram provides strategic guidance and monthly management for:
- Bid Management
- Budget Management & Optimization
- Identifying New Target and/or Testing Opportunities
- Analytics and Conversion Tracking
- Keyword Research and Optimization
- Ongoing Competitive Research
- Ad Creation
- Ad Copy Analysis and Testing
- Monthly reporting and insights
Social Media
In 2021, KI wanted to take a fresh look at their organic and paid social strategies, and they looked to their longtime partners at Diagram for insight.
Diagram performed an organic social media audit and competitive analysis. That analysis informed a “Social Media Playbook” with detailed recommendations for each platform to address tone, cadence, response protocol, call-to-action strategy, and more.
Diagram also provides ongoing strategic management of KI’s paid social efforts. Monthly management efforts include audience and budget planning, campaign set up and optimization, and monthly reporting. All efforts are coordinated to ensure that social strategy aligns with the client’s goals for engagement, traffic, and conversion.